Sawtooth pattern on the flow-volume loop

One of the recognized abnormalities of a flow-volume loop is a sawtooth profile due to flow oscillations that are superimposed on either the maximal expiratory or inspiratory flow curve, or the tidal loop.

FVL_Sawtooth_2

Sawtooth pattern on a flow-volume loop

The sawtooth pattern occurs in only a small fraction of patients but it is quite noticeable when you see it. Estimates of the number of individuals with flow oscillation range from 1.4% to 13.4% with the higher estimates being observed primarily with inspiratory loops. Since many spirometry efforts are concentrated solely on exhalation this means that it may frequently go unrecognized. Recently, I had several reports with distinct sawtooth flow-volume loops come across my desk within a short time period and for this reason thought it might be interesting to re-visit this old subject. I call it old only because most of the research on sawtooth profiles was done in the 1970’s and 1980’s and not much has been published since then.

Continue reading

What’s wrong with this picture?

I had mentioned previously that my PFT Lab has been questioned why the percent predicted Residual Volume (RV) measurements on some research patients were coming out so much lower at my lab than at some other PFT Labs. At that time the researchers had not shared the results they had from these patients so we could only speculate that either our RV’s were actually lower or that the predicted RV values used by the other PFT Labs were different than ours. We finally got a copy of the PFT report for one of these patients and it turns out that both answers were correct.

First, the predicted RV from what I will call Lab X (I am not familiar with the lab nor with any of the physicians or technicians there) was 15% lower than ours. My lab is using the reference equations from Stocks et al which are recommended by the ERS. I was unable to determine which sets of reference equations Lab X was using. They weren’t listed on the report and the calculated values didn’t seem to match any of the reference equations I have on hand. Our lab software uses the predicted RV plus the predicted Forced Vital Capacity (FVC) (from NHANESIII) to calculate predicted Total Lung Capacity (TLC). It is possible that Lab X’s software calculates the predicted RV by subtracting their predicted FVC from a predicted TLC.

I am not, however, going to try to argue that my lab’s predicted values are better than those of Lab X, just that they are different. The ATS has not officially recommended any particular set of lung volume reference equations and I think it would be easy to argue that all current reference equations are flawed to one extent or another. I would like to know how they were derived at Lab X but that is just to satisfy my own curiosity. Using Lab X’s predicted RV, our measured RV was 179% of predicted where by our reference equations it was 152% of predicted. This explains part of the difference in percent predicted values but by no means all of it.

When I looked at the actual test results from Lab X however, I saw numerous errors in the lung volume test and test calculations.

Continue reading

Zero offset in DLCO: system error or patient physiology?

I’ve noticed for a while that there has often been more variance between DLCO tests than I’d like to see. Some of this is of course attributable to differences in the way the patient performs each test. I am not overly surprised to see tests with different inspired volumes, different breath-holding times, different inspiratory times etc. etc. produce different results (in fact I am surprised that so many tests that have been performed differently frequently end up with almost identical results).

All too often though, I see tests that look like they were performed identically and yet have noticeably different results. For this reason I have been paying attention to small details to see if I can understand why this variance has been happening. I am well aware that there are “hidden” factors such as airway pressure (Valsalva or Mueller maneuvers) and cardiac output that can affect pulmonary capillary blood volume and therefore the DLCO. It is quite possible that much of the test-to-test variation is a result of these kinds of factors but I’ve also found several test system software and hardware errors that have lead to differences as well.

I am annoyed to say that I’ve found what could either be another system error or possibly a patient physiological factor that can lead to mis-estimated DLCO results. I’m annoyed not because I found it but because I’ve been looking at the DLCO test waveforms for a long time and never noticed this problem before. Of course since I’ve noticed it I now see it frequently.

Continue reading

FRC baseline shift affects TLC and RV

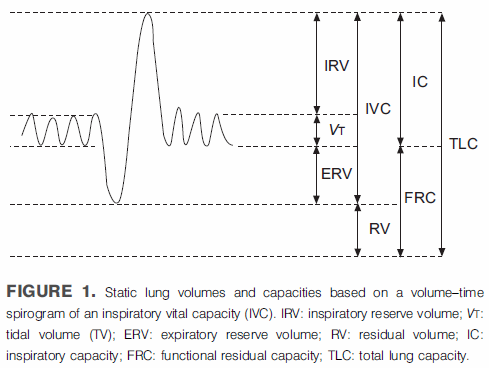
The plethysmographic technique for measuring lung volumes determines FRC first and then uses a slow vital capacity maneuver to calculate TLC and RV. FRC is defined as the volume of the lung at the end of a normal exhalation. The two components of the SVC maneuver that are used to calculate TLC and RV are the Inspiratory Capacity (IC) and the Expiratory Reserve Volume (ERV) and they too are measured relative to FRC. It would therefore seem to be important to have an accurate notion as to where FRC is in relation to TLC and RV when measuring lung volumes.

From ATS-ERS Standardisation of lung volume measurements, page 512

From ATS-ERS Standardisation of lung volume measurements, page 512

Plethysmography measures lung volumes by having a patient pant against a closed shutter and measuring pressure changes. The test is usually performed by having the patient breathe tidally for a period in order to determine where end-exhalation (FRC) is located, closing the shutter and performing the measurement, then returning to tidal breathing and performing the SVC maneuver. A critical assumption in this process is that the FRC baseline does not change while the shutter is closed.

Continue reading